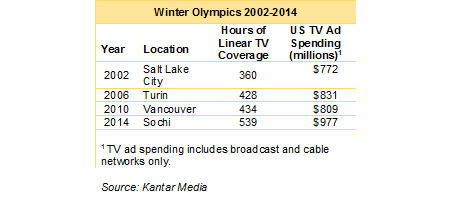
According to an analysis conducted by Kantar Media, national TV ad spending in the 2014 Winter Olympics reached a record of $977 million, easily beating the previous high of $831 million set in 2006, while the 539 total hours aired by NBCU across its broadcast and cable networks also set a record and represented an increase of nearly 25 percent from 2010.
These milestones are likely to be eclipsed by the 2018 Winter Olympics in PyeongChang, South Korea, showing the continued strength of event-based TV. The competition starts February 8th and the Opening Ceremony takes place on February 9th. The 17-day event will attract a sizable audience of Americans who will have unprecedented options to follow on television and digital platforms. NBC Universal plans to show more than 625 hours of programming on its linear TV channels and 1,800+ hours of live streaming video coverage, a significant increase from the 2014 Olympics.
Kantar Media has mined its extensive database to compile a variety of trend statistics and insights on Winter Olympics advertising.
2014 TV Ad Revenue Hits a Record
National TV ad spending in the 2014 Winter Olympics reached a record of $977 million, easily beating the previous high of $831 million set in 2006. It was the third highest-grossing sporting event of that year after the NFL post-season ($1.23 billion of TV spending) and the NCAA Men’s Basketball Tournament ($1.13 billion).
The Sochi Games set another record, with NBCU airing 539 hours of Olympic coverage on its broadcast and cable TV networks, an increase of nearly 25 percent from 2010. In addition to linear TV, more than 1,000 hours of live streaming video coverage was offered at nbcolympics.com.
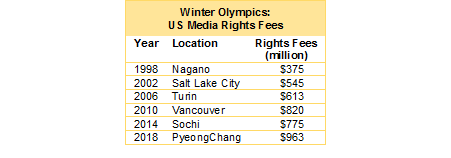
Media Rights Fees Have Increased 150% In Twenty Years
Domestic rights fees for the Winter Olympics have increased 150% over the past twenty years, and are approaching the billion-dollar threshold.
Source: NBC Universal
Future fees will be going up at a slower pace. The International Olympic Committee (IOC) pairs a Winter and Summer Games together and sells the media rights as a package. NBCU, which has the U.S. rights locked up through 2032, will see its fees increase from $2.38 billion for the 2018-2020 pairing to $2.59 billion in 2030-2032 for an average increase of 3 percent per cycle.
More Hours of Coverage Equals More Ad Inventory
The big increase between 2010 and 2014 in linear TV programming resulted in more commercial units for sale. NBCU cable properties were the main beneficiaries. At the 2014 Sochi Games, 66 percent of programming hours and 54 percent of ad time were on these complementary channels.
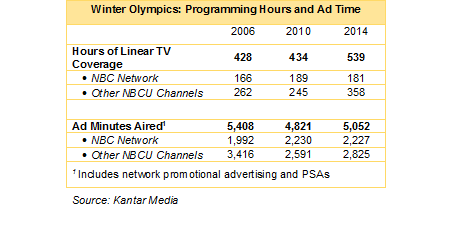
Even though Olympics programming is spread across multiple channels, the NBC broadcast network gets an overwhelming majority of the viewing. This will be true again in 2018. The drawing power of NBC is aided by its programming focus on events with strong audience appeal, such as figure skating, snowboarding and alpine skiing. In past Winter Olympics, NBCU cable networks typically finished their daily Olympics coverage by 8 pm, leaving a clear field for NBC’s primetime telecasts. That will change this year. NBC Sports Network will be the lead cable network and it will feature 10 days of 24-hour coverage as well as live primetime coverage nearly every night throughout the Games.
In 2014 the NBC telecasts had an average 54 percent more paid ad time per hour as compared to sister cable networks. Within NBC’s full-day Olympic schedule, primetime had a slightly heavier ad load than other dayparts. Squeezing more sponsor messages into higher-rated programming is an established monetization strategy.
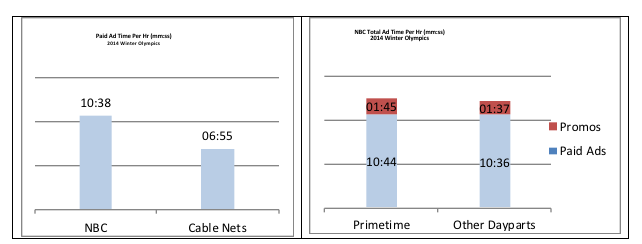
Source: Kantar Media
Due to the combination of larger audiences and more ad time, the NBC network by itself accounted for approximately 85 percent of the audience delivery in the 2012 Olympics. NBC primetime was responsible for about 55 percent.
Ad Pricing
The blended average price for a 30 second unit in the 2014 Winter Olympics across all network and cable channels was $112,800. The amount paid by individual marketers can vary considerably depending on a variety of factors. These include how much ad time is purchased, the mix of premium and non-premium inventory, sponsorship positions and packaging of TV spots with digital inventory.
One outcome of more programming content is audience fragmentation as viewers distribute their consumption across the expanding array of linear and digital options, leading to declines in average unit rates given the lower available audience. However, having more choices can increase the aggregate number of Olympics viewers even as the average audience per channel and per spot declines. Ad revenue growth thus becomes more dependent on volume than average price

A Concentration of Ad Spending
The number of marketers buying TV time in the 2014 Games declined sharply as compared to the prior two Winter Olympiads and spending became more concentrated among the Top Ten sponsors.
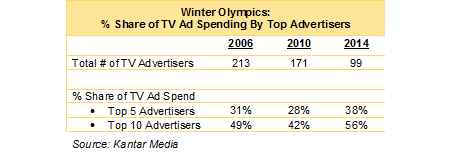
Many top-tier sporting events are experiencing a similar consolidation of TV ad spending. Marketers are attracted to these properties for the many benefits they offer including sponsorship opportunities, category exclusivity, building integrated multi-channel programs and a DVR-proof viewing audience. With these extra elements come additional costs, including the price of TV spots. Advertisers with deep pockets are in a stronger position to execute this strategy and in doing so they are squeezing out other marketers.
Leading Advertisers
The ten largest TV advertisers in the 2014 Olympics spent a total of $556 million. Nine of the ten also had top-level sponsorship deals at the time with either the global IOC or the domestic United States Olympic Committee (USOC). These positions entitle companies to additional marketing rights, including the use of designated Olympic images and marks. The actual marketing and advertising campaigns themselves are an incremental expense.
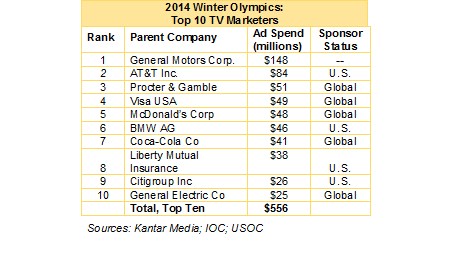
The 2014 TV advertiser roster included 17 global and domestic Olympic sponsors and they accounted for 51 percent of total ad expenditures.
Top Ad Categories
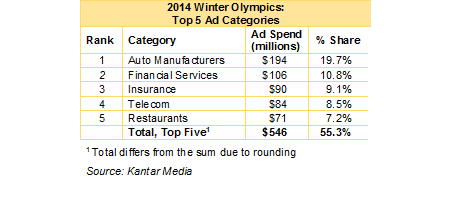
The leading ad categories in the Winter Olympics reflect the Top Advertiser list since many of these companies have exclusivity deals limiting access by competitors. Auto Manufacturers were the leading category in the Sochi Games with $194 million of spending, all of it from General Motors and BMW. The Top 5 categories registered $546 million of expenditures.
The Endorsement Olympics
Corporate partners are an important source of revenue for both the International and United States Olympics Committees. In the four years from 2013-2016, the IOC earned $1.0 billion from the sale of global marketing rights around the Olympic movement. The comparable figure for the USOC, which controls domestic rights, was $387 million – 42 percent of its gross revenue.
Since the 2016 Summer Olympics, an unusually large number of corporations either terminated or chose not to renew their marketing sponsorships. McDonald’s walked away from the IOC while Anheuser-Busch InBev, AT&T, BMW, BP, Citigroup, Hilton and TD Ameritrade dropped out of the USOC program. Though some new partners have come into the fold, the USOC entered 2018 with a portfolio of 22 official sponsors versus 28 in 2016.
Athletes also have a stake. Fewer official sponsors means fewer opportunities for personal endorsement deals that can be an important source of income. Athletes can sign deals with any company but those with rights to use Olympics marks and symbols have more motivation and reason to align their brands with marketable Olympians. It’s not uncommon for top-tier sponsors to build their own “Olympic team” by signing several athletes as brand ambassadors.
During the coming weeks, some of these athletes will appear in media advertising from their corporate sponsors. Kantar Media will again be monitoring the “Endorsement Olympics” and the amount of spending connected to Team USA participants. We will also be reporting on trends in who’s advertising and how much they’re spending on the PyeongChang Games.
Visit kantarmedia.com to see latest analyses throughout the Games.

