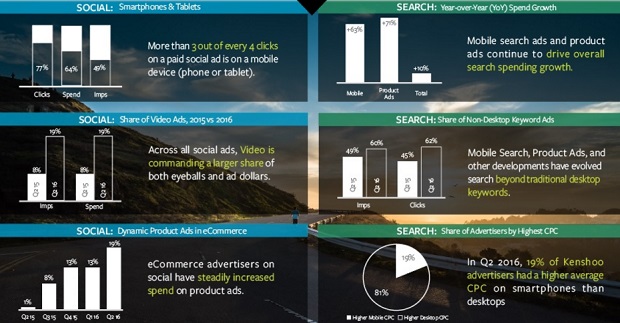
Spend on search ads continues to grow, with advertisers increasingly taking advantage of newer ad types, according to new research.
Spend on social advertising has increased by 47% year-on-year (YoY) in the second quarter of 2016, with social ads attracting a 21% higher cost-per-click (CPC) as they become more specialised and valuable according to the latest quarterly global data from Kenshoo, the global leader in agile marketing.
Growth continues to be driven by mobile, which accounts for 64% of spend, with retailers’ Dynamic Product Ads on Facebook and Instagram, as well as video, playing an increasing role in paid social.
Budgets directed to mobile search ads and Product Listing Ads (PLAs) climbed 63% and 71%, respectively, leading to a rise in overall search advertising spend of 10% YoY. The data underlines how paid search is evolving beyond traditional keyword-based desktop ads with 62% of search clicks and 60% of impressions now coming from mobile, PLAs, app ads and others. Total clicks on PLAs have more than doubled (going up 2.21X) since the same quarter last year
.
The findings of the study are presented in a new infographic, Kenshoo Digital Marketing Snapshot: Q2 2016, highlighting key quarterly global metrics and benchmarks for social advertising and paid search based on five quarters of performance, analysing more than 550 billion impressions, 11 billion clicks and $6 billion (USD) in advertiser spend through the Kenshoo Infinity Suite.
View the infographic below:

Kenshoo’s data reveals that consumers are more likely to click on social ads now, with click-through rate (CTR) up 17% and overall clicks on social rising by 21% since Q2 last year. Mobile is a key part of this, with more than 3 out of every 4 clicks (77%) and 49% of impressions from paid social ads coming from mobile devices (phone or tablet).
Product ads — specifically Dynamic Ads for Products on Facebook, which were introduced last year to help online retailers sell products and have since also become available on Instagram — now account for 19% of paid social spend by eCommerce and online retail sites.
Video ads, which are available across both Facebook and Instagram, are attracting greater interest, accounting for 19% of all spend and impressions on paid social (compared with 8% of spend and impressions last year).
In paid search, 41% of clicks and 30% of spend came from smartphones in Q2 (compared to 26% and 21% last year). The cost-per-click (CPC) of search ads across all devices was higher in the second quarter compared to the previous quarter, and upcoming changes to keyword bidding that are accompanying the migration to Expanded Text Ads will likely continue this trend into future quarters.
Rob Coyne, Kenshoo’s Managing Director for EMEA, said: “The study brings to light how both social and search are advancing, with a greater variety of ad types designed to help marketers’ meet specific goals, all contributing to double-digit growth in spend on both channels. In social, marketers are benefiting from Dynamic Ads for retail – now also available for travel – and making increasing use of video. While in search, the majority of clicks are coming from sources other than the original desktop-focused keyword ad, with increasing use of PLAs, app ads, dynamic search ads and others. Across both channels, all of these changes are underpinned by the unstoppable march towards more mobile advertising.”
The Kenshoo Infinity Suite leads the way in digital marketing innovation, enabling success for agile marketers by maximising customer lifetime value. Built upon Kenshoo’s industry-leading and award-winning digital marketing platform, the Kenshoo Infinity Suite delivers infinite optimisation to re-engage and grow customers across all channels and devices.
Visit Kenshoo.com/Digital-Marketing-Snapshot to download the new infographic, Kenshoo Digital Marketing Snapshot: Q2 2016.
Methodology
Social and search results are based on five quarters of performance data managed on the Kenshoo platform from over 3,000 advertiser and agency accounts across 20 vertical industries and over 60 countries, spanning Google, Bing, Baidu, Yandex, Yahoo!, Yahoo! Japan, and the Facebook® Audience Network. Some outliers have been excluded. The resulting sample includes more than 550 billion impressions, 11 billion clicks and $6 billion (USD) in advertiser spend. Ad spending and CPC are measured using Ex-FX or “Constant Currency” adjustments, where results are based on native currency, and only translated to common currency after aggregation.

