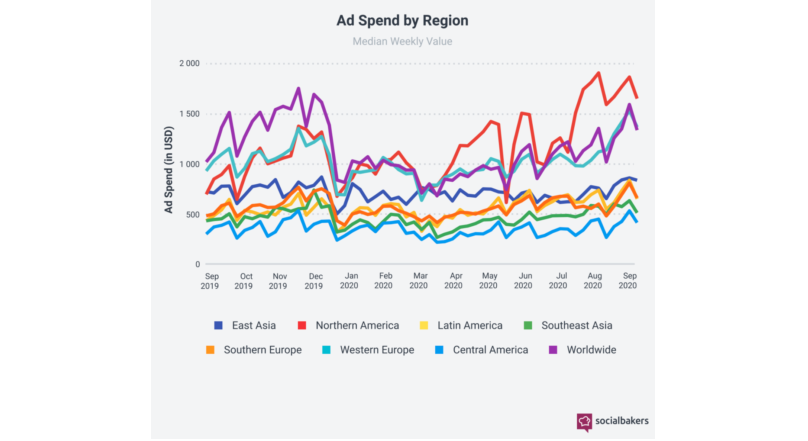
Global ad spend grew 56.4% in the third quarter of 2020, making average spend nearly double its level at the lowest point of the pandemic in late March, according to new research.
The latest Q3 trends report from Socialbakers, the leading social media marketing platform, has shown that despite a turbulent three quarters of COVID-related challenges in 2020, social media ad spend rose sharply in Q3 to pre-pandemic levels, led by increased investment in e-commerce ads.
This signals a healthy trust among marketers in the effectiveness of digital channels.
Other key findings include:
• Global ad spend soars 56.4% in Q3 2020, making average spend nearly double its level at the lowest point of the pandemic in late March
• CPC in Q3 2020 reaches same levels as Q3 2019, with the final week in September beating 2019, at 0.339 (versus 0.322), a 5% uplift
• Instagram continues to dominate – Instagram continues to generate significantly stronger engagement than Facebook, garnering 22x more interactions
• Ecommerce dominate Facebook, fashion takes over Instagram – Oh Polly takes the winning spot with 18 million interactions on Instagram
• Video format used mostly on Twitter, Facebook Live most engaging for Facebook –Facebook Live delivered double the interactions of the video format
“More than ever, today’s consumers are digitally grounded. The rapid shift towards digital presents both a challenge and an opportunity for brands. Socialbakers’ Q3 social media ad spend data shows us that savvy brands are doubling down their investment in advertising across Facebook and Instagram,” said Yuval Ben-Itzhak, President, Socialbakers. “In North America alone, brands have invested 61% more in Q3 than they did in Q2, largely due to confidence returning as consumers spend more time engaging and purchasing online.”
Global social media ad spend soars 56.4% in Q3 2020
Compared to Q2, worldwide social media ad spend increased by 56.4% in Q3, making average spend nearly double its level at the lowest point of the pandemic in late March. The largest increase took place in North America, where ad spend increased by 61.7%. In the UK, brands spent more in Q3 2020 than they did in Q3 2019 (see below), with a 43% uplift on ad spend in the last week of September year-on-year. Looking across all brands, ad spend was 27.6% higher in Q3 compared to the same period last year, after dropping below 2019 levels in March and April. In Q3, the average industry ad spend increased by 38.9% in Q3, with large jumps from FMCG Food (up 61.3%), Auto (up 59.4%), Finance (up 35.3%) and Ecommerce (up 27.5%).
CPC reaches its highest point since 2019
The worldwide cost-per-click increased by 42.4% in Q3, compared to where it was at the end of June. At $0.168, global CPC is now at its highest point since the end of 2019. Among the regions that saw significant CPC increases were Latin America (up 44.8%), Western Europe (up 30.8%) and North America (up 19.5%). For all brand accounts, CPC increased by 32.1% to $0.140, which is the highest it has been since December 2019. In the UK, CPC in September reached the same levels as Q3 2019 (see below), with the final week in September actually beating 2019, at 0.339 (versus 0.322), a 5% uplift.
Instagram continues to dominate
Instagram continued to outperform Facebook in Q3. Globally, the audience size of Instagram’s 50 biggest brand profiles was 34.7% larger than that of Facebook, but in the UK, the figures are almost equal. However, Instagram continues to generate significantly stronger engagement than Facebook, garnering 22x more interactions. Despite this, 61.9% of all brand posts in Q3 were published on Facebook. Worldwide, Facebook ad reach increased on average by 12.3%.
Daily News and NGOs see major spikes in interactions
As one might expect during the pandemic and elections, the Daily News and NGO industries saw a steep rise in engagement in Q3. Daily News interactions rose 103.3% on Instagram and 57.8% on Facebook, while NGOs interactions rose 112.9% on Facebook and 31.2% on Instagram. Interestingly, Travel industry interactions increased by 60.9% on Facebook, yet decreased by 31.2% on Instagram.
In the UK, ecommerce brands continue to take the biggest share of interactions on Facebook, with 44.3%, and even bigger than in Q2 2020 with 36.8%. On Instagram, fashion brands continue to dominate, with Oh Polly taking the winning spot with 18,400,000 interactions, followed by Pretty Little Thing with 11,800,000 and Missguided coming in third with 11,400,000 interactions.
Facebook Live and longer videos are top performers
In the UK, when comparing the usage of video content across platforms, video is used the most on Twitter. When looking into Facebook, Facebook Live was by far the most engaging format for that channel in Q3. It delivered double the interactions of the video format. On Instagram, carousel posts that can include both images and video were the most engaging format in Q3. Organic interactions across all formats on Instagram showed an increase in Q3. However, on Facebook only Facebook Live showed increased interactions, while other formats remained flat compared to Q2.
When it comes to the overall top-performing formats in terms of both reach and interactions on Facebook, the winners were long and very long videos. The reach was best for very long videos (over 5 minutes) which achieved a 70.4% higher reach than the second best video length (long). However, the performance of very long videos has been declining over the last seven months. In Q3, long videos (over 65.194 seconds but shorter than 5 minutes) had the top performance index at 23.2%.
“If Q3’s insights show us anything, it’s that brands need to make sure they pivot quickly to follow the consumer trends towards digital,” said Ben-Itzhak. “The brands that react quickly today and focus on delivering an outstanding customer experience to their audience online will be the brands that come out on top tomorrow.”
The Socialbakers’ Social Media Trends Report Q3 2020 is available for download here
Source: www.socialbakers.com
