User-generated content (UGC) Is a popular strategy on social media, but does user generated content (UGC) actually influence consumers? New research suggests consumers prefer user posts on brand’s Instagram than other channels.
According to new data from Visual Objects, UGC perfoms better on Instagram, but not necessarily on other platforms such as YouTube and Twitter.
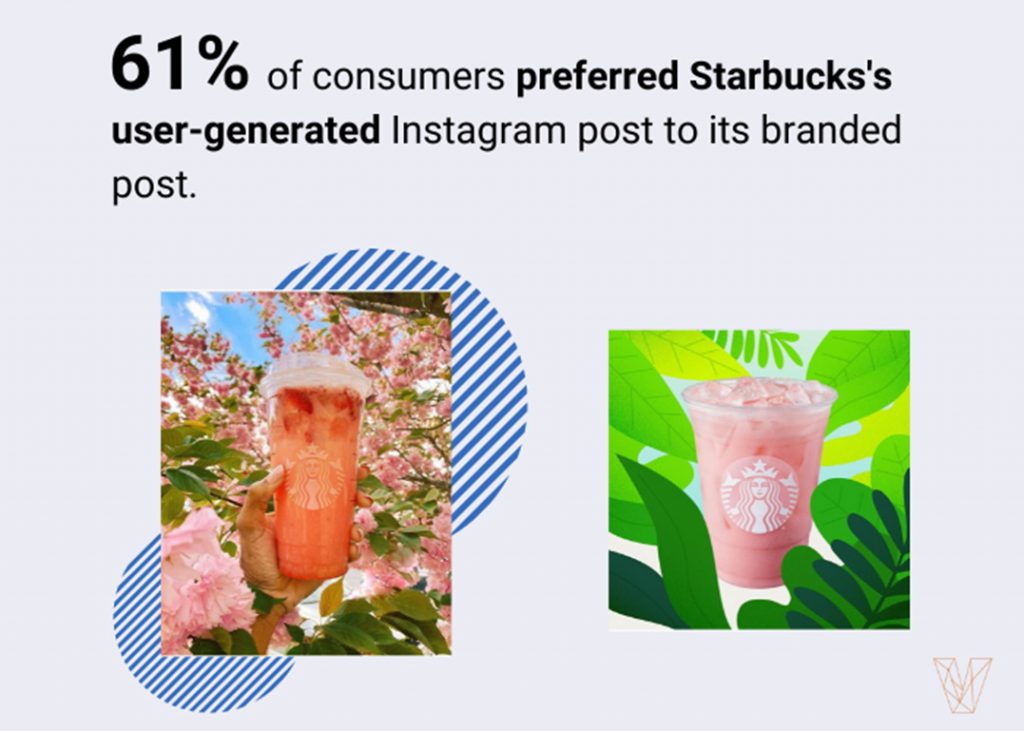
About 61% of consumers prefer Starbucks’ UGC posts on Instagram, while 68% of people prefer Netflix’s original, branded posts on Twitter over its user-generated tweets. In addition, 71% of people prefer FabFitFun’s branded video over a user-generated “unboxing” video.
The survey asked 401 people in the U.S. which type of content – branded or user-generated – would be more likely to drive them to make a purchase. We found that user-generated posts on Instagram are more effective at driving purchases than UGC on YouTube or Twitter.
Key Findings
- More than half of people chose user-generated images from Starbucks (61%) and clothing brand Aerie (60%). This shows the potential of user-generated content to drive sales for businesses.
- Only 30% of people said a user-generated Instagram post from vacation rental company Getaway House would lead them to make a purchase. This shows Instagram’s limitations for brands using UGC.
- Most people (71%) preferred a branded YouTube video from subscription box FabFitFun to a user-generated unboxing video. UGC on YouTube works best when it includes products from multiple competing brands.
- About two-thirds of people (68%) preferred a direct tweet from Netflix over a user-generated tweet. User-generated content on Twitter can be helpful for businesses looking for more Twitter content.
About the Survey
Visual Objects surveyed 401 people in the United States. Less than half of respondents (42%) identified as female, 39% identified as male, and 19% declined to self-identify. One-fifth of respondents (11%) are ages 18-24, 18% are ages 25-34, 19% are ages 35-54, 13% are 55 and above, and 21% declined to identify their age. Respondents are from the South (36%), Midwest (27%), West (23%), and Northeast (17%).
